Making TidierPlots.jl
If you're unfamiliar, TidierPlots is my attempt to build a more modern-feeling, 100% julia version of the popular R data visualization package ggplot2. This is my first julia package, and I have already made quite a few mistakes in developing it. This series of posts will walk through my experience of transforming a script into a package, the problems I've had, and the solutions I've come up with so far.
Version 1
To start, I want to show you the basic idea of the package, as it existed when I first wrote out the original script. The 100-or-so lines of julia I had were enough to get something like a minimal working example going:
test_plot = @ggplot(data = penguins, aes(color = species)) +
    @geom_point(aes(x = bill_length_mm, y = bill_depth_mm)) +
    @geom_smooth(aes(x = bill_length_mm, y = bill_depth_mm),
        method = "lm")

draw_ggplot(test_plot)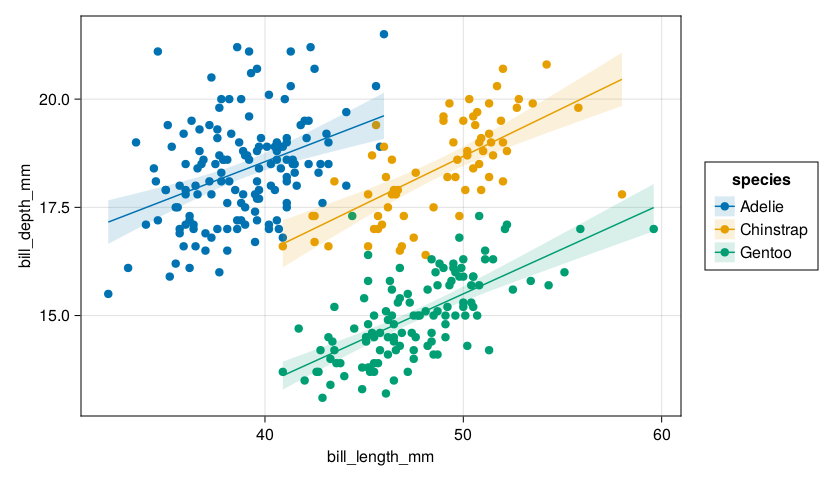
At the risk of over-explaining, lets look at what is happening here. First, the @ggplot call is calling this code to create a ggplot:
struct ggplot
    geoms::AbstractArray
    default_aes::Dict
    data::Symbol
    axis::NamedTuple
end

function extract_aes(geom)
    aes_dict = Dict{String, Symbol}()
    args_dict = Dict{String, Any}()

    for section in geom
        if section isa Expr
            # if the section is an expression
            # check if it is a aes function call
            if section.args[1] == :aes
                for aes_ex in section.args
                    if aes_ex isa Expr
                        aes_dict[String(aes_ex.args[1])] = aes_ex.args[2]
                    end
                end
            # if not, its a generic argument
            else
                args_dict[String(section.args[1])] = section.args[2]
            end
        end
    end

    return (aes_dict, args_dict)
end

macro ggplot(exprs...)
    aes_dict, args_dict = extract_aes(:($(exprs)))

    haskey(args_dict, "height") ?
        height = args_dict["height"] :
        height = 400

    haskey(args_dict, "width") ?
        width = args_dict["width"] :
        width = 600

    haskey(args_dict, "data") ?
        plot_data = args_dict["data"] :
        plot_data = nothing

    ggplot([], aes_dict,
            AlgebraOfGraphics.data(Base.eval(Main, plot_data)),
            (height = height, width = width))
end
In a diagram, what's going on is this:
┌─────────┬────────────────────────────────────────┐
│ @ggplot |(data = penguins, aes(color = species)) │
└─────────┴────────────────────────────────────────┘
     │                       │
     │ defaults              │ extract_aes
     │                       │
     │   ┌─────────────────────────────────────────┐
     └───| aes_dict: "color" => "species"          │
         │ args_dict: "data" => "penguins"         │
         │            "height" => 400              │
         │            "width" => 600               │
         └─────────────────────────────────────────┘
                             │
                             │ returns
          ggplot object      │
         ┌─────────────────────────────────────────┐
         | geoms = []  # empty, currently          │
         │ default_aes: "color" => "species"       │
         │ plot_data: penguins                     │
         │ axis: (height = 400, width = 600)       │
         └─────────────────────────────────────────┘
The extract_aes function pulls the arguments into a dictionary, combines them with defaults as appropriate, and the @ggplot macro finally returns a ggplot object.
Similar code creates geom objects:
struct geom
    visual::Union{Symbol, Nothing}
    aes::Dict
    args::Dict
    analysis::Any
    required_aes::AbstractArray
end

macro geom_point(exprs...)
    geom_visual = :Scatter
    aes_dict, args_dict = extract_aes(:($(exprs)))
    analysis = nothing
    required_aes = ["x", "y"]
    return geom(geom_visual, aes_dict, args_dict, nothing, required_aes)
end
┌─────────────┬──────────────────────────────────────────────┐
│ @geom_point | (aes(x = bill_length_mm, y = bill_depth_mm)) │
└─────────────┴──────────────────────────────────────────────┘
│ │
│ defaults │ extract_aes
│ │
│ ┌─────────────────────────────────────────┐
│ | aes_dict: "x" => "bill_length_mm" │
│ │ "y" => "bill_depth_mm" │
│ └─────────────────────────────────────────┘
│ │
│ │ returns
│ geom_point_object │
│ ┌─────────────────────────────────────────┐
│ | visual = :Scatter │
│ │ aes: "x" => "bill_length_mm" │
│ │ "y" => "bill_depth_mm" │
└─── │ args: Dict() │
│ analysis: nothing │
│ required_aes: ["x", "y"] │
└─────────────────────────────────────────┘
macro geom_smooth(exprs...)
    geom_visual = nothing
    aes_dict, args_dict = extract_aes(:($(exprs)))
    analysis = AlgebraOfGraphics.smooth
    required_aes = ["x", "y"]
    if haskey(args_dict, "method")
        if args_dict["method"] == "lm"
            analysis = AlgebraOfGraphics.linear
        end
    end
    return geom(geom_visual, aes_dict, args_dict, analysis, required_aes)
end
┌──────────────┬─────────────────────────────────────────────┐
│ @geom_smooth | (aes(x = bill_length_mm, y = bill_depth_mm),│
│ │ method = "lm") │
└──────────────┴─────────────────────────────────────────────┘
│ │
│ defaults │ extract_aes
│ │
│ ┌─────────────────────────────────────────┐
│ | aes_dict: "x" => "bill_length_mm" │
│ │ "y" => "bill_depth_mm" │
│ │ args_dict: "method" => "lm" │
│ └─────────────────────────────────────────┘
│ │
│ │ returns
│ geom_smooth_object │
│ ┌─────────────────────────────────────────┐
│ | visual = nothing │
│ │ aes: "x" => "bill_length_mm" │
│ │ "y" => "bill_depth_mm" │
└─── │ args: "method" => "lm" │
│ analysis: AlgebraOfGraphics.linear │
│ required_aes: ["x", "y"] │
└─────────────────────────────────────────┘
The extract_aes function pulls the arguments into a dictionary, combines them with defaults as appropriate, and the @geom_* macro finally returns a geom object.
With our objects created, we need a method to combine them. The following method to adds things to a ggplot, which essentially just adds any geom to an internal array inside the ggplot:
function Base.:+(x::ggplot, y...)::ggplot
    result = ggplot(vcat(x.geoms, [i for i in y]),
        x.default_aes,
        x.data,
        x.axis)

    return result
end
The result of our addition is something like this:
ggplot object
┌──────────────────────────────────────┐
| geoms =                              │
│┌────────────────────────────────────┐│
│| visual = nothing                   ││
││ aes: "x" => "bill_length_mm"       ││
││      "y" => "bill_depth_mm"        ││
││ args: "method" => "lm"             ││
││ analysis: AlgebraOfGraphics.linear ││
││ required_aes: ["x", "y"]           ││
│└────────────────────────────────────┘│
│┌────────────────────────────────────┐│
│| visual = :Scatter                  ││
││ aes: "x" => "bill_length_mm"       ││
││      "y" => "bill_depth_mm"        ││
││ args: Dict()                       ││
││ analysis: nothing                  ││
││ required_aes: ["x", "y"]           ││
│└────────────────────────────────────┘│
│                                      │
│ default_aes: "color" => "species"    │
│ plot_data: penguins                  │
│ axis: (height = 400, width = 600)    │
└──────────────────────────────────────┘
In order to actually plot this object, I needed a way to convert the geom objects into AlgebraOfGraphics Layer objects:
function geom_to_layer(geom)
    mapping_args = (geom.aes[key] for key in geom.required_aes)

    layer = data(eval(geom.args["data"])) *
        mapping(mapping_args...)

    if !isnothing(geom.analysis)
        layer = layer * (geom.analysis)()
    end

    if !isnothing(geom.visual)
        layer = layer * visual(eval(geom.visual))
    end

    if haskey(geom.aes, "color")
        layer = layer * mapping(color = geom.aes["color"])
    end

    return layer
end
And finally, some basic inheritance rules to make it work the way ggplot does:
function draw_ggplot(plot::ggplot)
    for geom in plot.geoms
        # if data is not specified at the geom level
        #  use the ggplot default
        if !haskey(geom.args, "data")
            geom.args["data"] = plot.data
        end

        # if an aes isn't given in the geom, use the ggplot aes
        for aes in keys(plot.default_aes)
            if !haskey(geom.aes, aes)
                geom.aes[aes] = plot.default_aes[aes]
            end
        end
    end

    layers = []

    for geom in plot.geoms
        push!(layers, geom_to_layer(geom))
    end

    if length(layers) == 0
        error("No geoms supplied")
    elseif length(layers) == 1
        draw(layers[1]; axis = plot.axis)
    else
        draw((+)(layers...); axis = plot.axis)
    end
end
Algebra of Graphics plots need four parts: Visual, Analysis, Data, and Mapping. Each required part is extracted preferentially from the geom, and from the ggplot if it isn't present. Mapping is constructed by passing the "required_aes" in order as positional arguments, and non-required aes as keyword arguments.
ggplot object
┌──────────────────────────────────────┐
| geoms =                              │
│┌────────────────────────────────────┐│
│| visual = nothing                   ││
││ aes: "x" => "bill_length_mm" ──────┼┼─┬── mapping(:bill_length_mm,
││      "y" => "bill_depth_mm"  ──────┼┼─┤           :bill_depth_mm;
││ args: "method" => "lm"             ││ │           color = :species)
││ analysis: AlgebraOfGraphics.linear ││ │
││ required_aes: ["x", "y"]     ──────┼┼─┤
│└────────────────────────────────────┘│ │
│┌────────────────────────────────────┐│ │
│| visual = :Scatter                  ││ │
││ aes: "x" => "bill_length_mm"       ││ │
││      "y" => "bill_depth_mm"        ││ │
││ args: Dict()                       ││ │
││ analysis: nothing                  ││ │
││ required_aes: ["x", "y"]           ││ │
│└────────────────────────────────────┘│ │
│                                      │ │
│ default_aes: "color" => "species" ───┼─┘
│ plot_data: penguins                  │
│ axis: (height = 400, width = 600)    │
└──────────────────────────────────────┘
Data comes from the "data" value in the geom's arg dict if available (it's not), and from plot_data in the ggplot otherwise:
ggplot object
┌──────────────────────────────────────┐
| geoms =                              │
│┌────────────────────────────────────┐│
│| visual = nothing                   ││
││ aes: "x" => "bill_length_mm"       ││
││      "y" => "bill_depth_mm"        ││
││ args: "method" => "lm"             ││
││ analysis: AlgebraOfGraphics.linear ││
││ required_aes: ["x", "y"]           ││
│└────────────────────────────────────┘│
│┌────────────────────────────────────┐│
│| visual = :Scatter                  ││
││ aes: "x" => "bill_length_mm"       ││
││      "y" => "bill_depth_mm"        ││
││ args: Dict()                       ││
││ analysis: nothing                  ││
││ required_aes: ["x", "y"]           ││
│└────────────────────────────────────┘│
│                                      │
│ default_aes: "color" => "species"    │
│ plot_data: penguins ─────────────────┼─ data(penguins)
│ axis: (height = 400, width = 600)    │
└──────────────────────────────────────┘
Visual and Analysis always come from the geom:
ggplot object
┌──────────────────────────────────────┐
| geoms =                              │
│┌────────────────────────────────────┐│
│| visual = nothing ──────────────────┼┼─ no visual
││ aes: "x" => "bill_length_mm"       ││
││      "y" => "bill_depth_mm"        ││
││ args: "method" => "lm"             ││
││ analysis: AlgebraOfGraphics.linear ┼┼─ linear()
││ required_aes: ["x", "y"]           ││
│└────────────────────────────────────┘│
│┌────────────────────────────────────┐│
│| visual = :Scatter ─────────────────┼┼─ visual(:Scatter)
││ aes: "x" => "bill_length_mm"       ││
││      "y" => "bill_depth_mm"        ││
││ args: Dict()                       ││
││ analysis: nothing ─────────────────┼┼─ no analysis
││ required_aes: ["x", "y"]           ││
│└────────────────────────────────────┘│
│                                      │
│ default_aes: "color" => "species"    │
│ plot_data: penguins                  │
│ axis: (height = 400, width = 600)    │
└──────────────────────────────────────┘
So this all translates to the AoG code:
data(penguins) *
  visual(:Scatter) *
  mapping(:bill_length_mm, :bill_depth_mm; color = :species) +
data(penguins) *
  linear() *
  mapping(:bill_length_mm, :bill_depth_mm; color = :species) |>
  draw(axis = (height = 400, width = 600))
Which produces the plot! At this point, I was convinced that this was going to be easy, and I pushed essentially this code plus a PkgTemplates skeleton to a repo as version 0.1.0. How hard could this really be?